At the end of June, at the half year mark of 2026, I had read 98 books, a total of 37 583 pages.That’s a lot of books, a lot of pages, a lot of enjoyment. I tried to translate that to hours > work days (8h), but it looked kinda rediculous. I mean, with an average of 40 pages/h it would make 120 work days (out of what, 176 days total?), with the average of 50 pages/h, 95 work days. Though, I DO read an average of 4,5h per day, so calculating with that, I have spent 99 work days (792h) reading, which makes 47 pages/hour. So ok, accurate, I guess.
I don’t have a life, I have multiple.
I’m generally no good at ranking anything – I mean, how does one REALLY choose a best of so many somethings that are all different and touch and delight me each in their unique way?
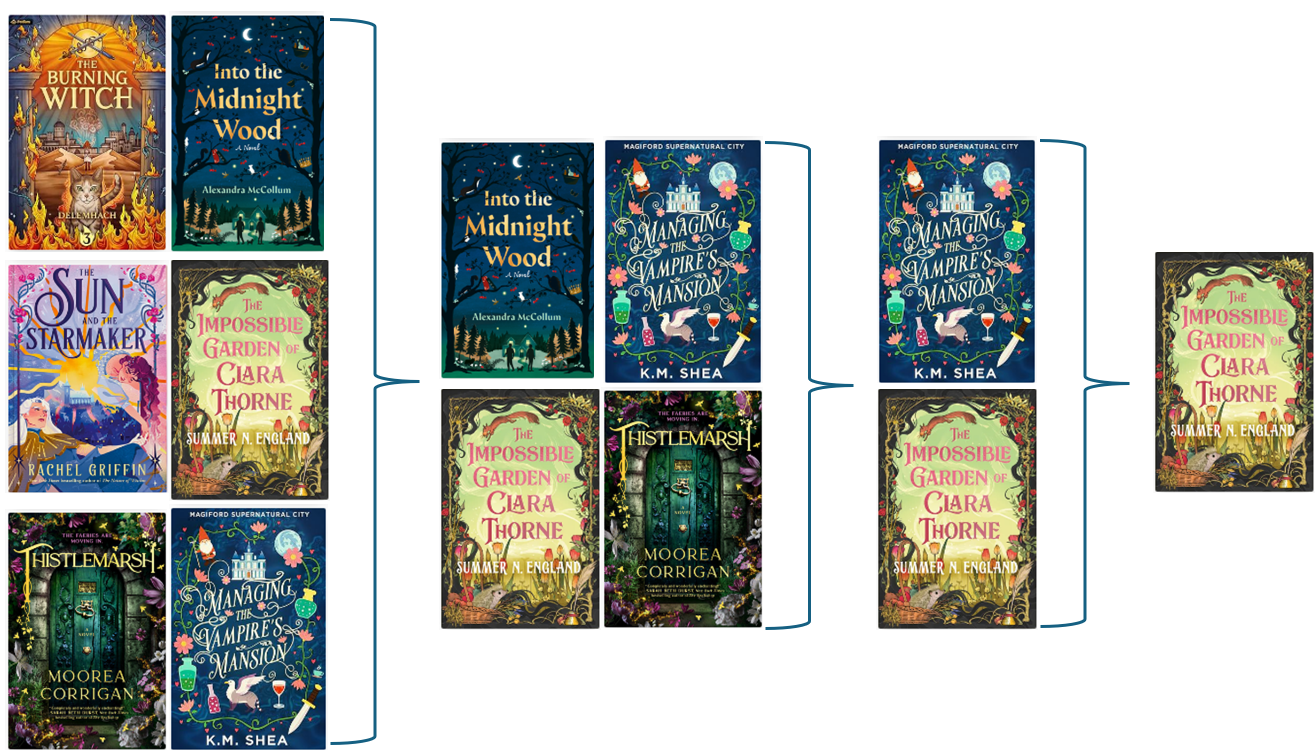
Still, I always try to somehow pick some favorite books to showcase in my yearly wrap-ups (blog posts), just to highlight some out of the mass. For the yearly review, I usually make several categories for this, but now, for the first time, I attempted a simple Best of H1/2026 ranking by selecting one for each month and narrowing it down from there.
I can tell you even THIS was NOT easy! Out of an average of 16 books per month, almost 100 books. I tried to go with a “If I had to choose only one of these to reread…” approach and this is what I got.
The winner is: The Impossible Garden of Clara Thorne, by Summer N. England.
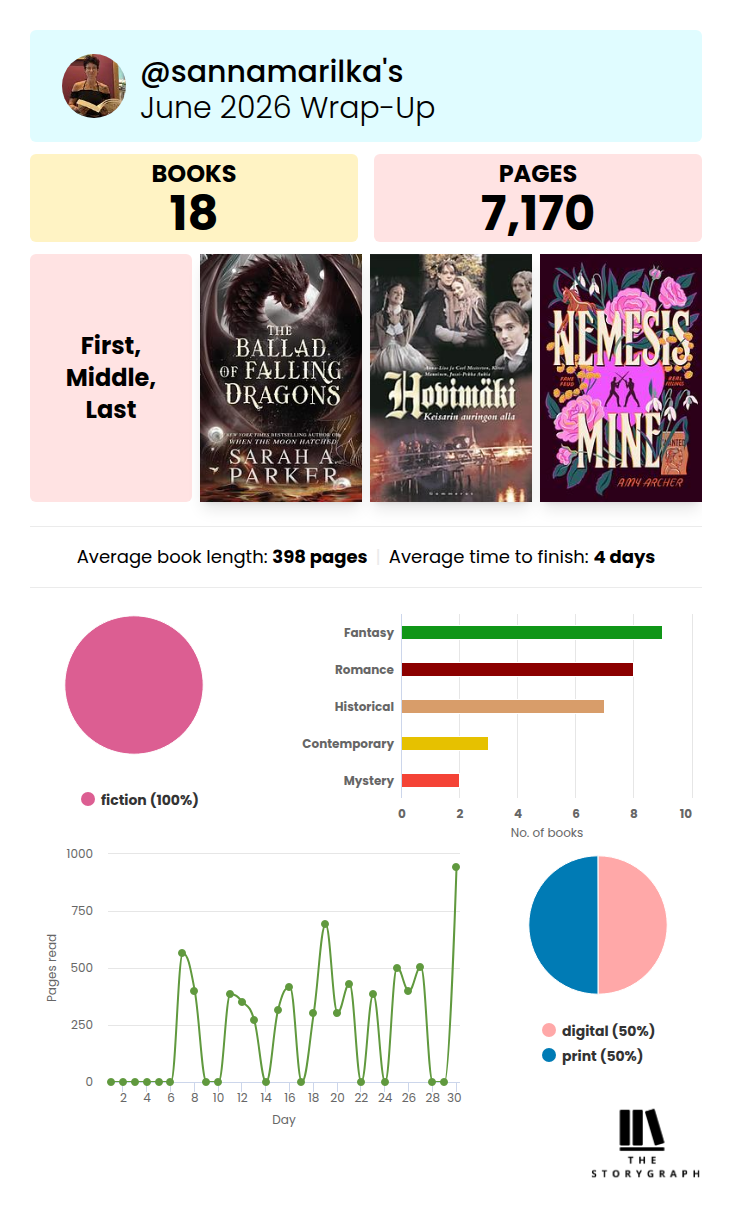
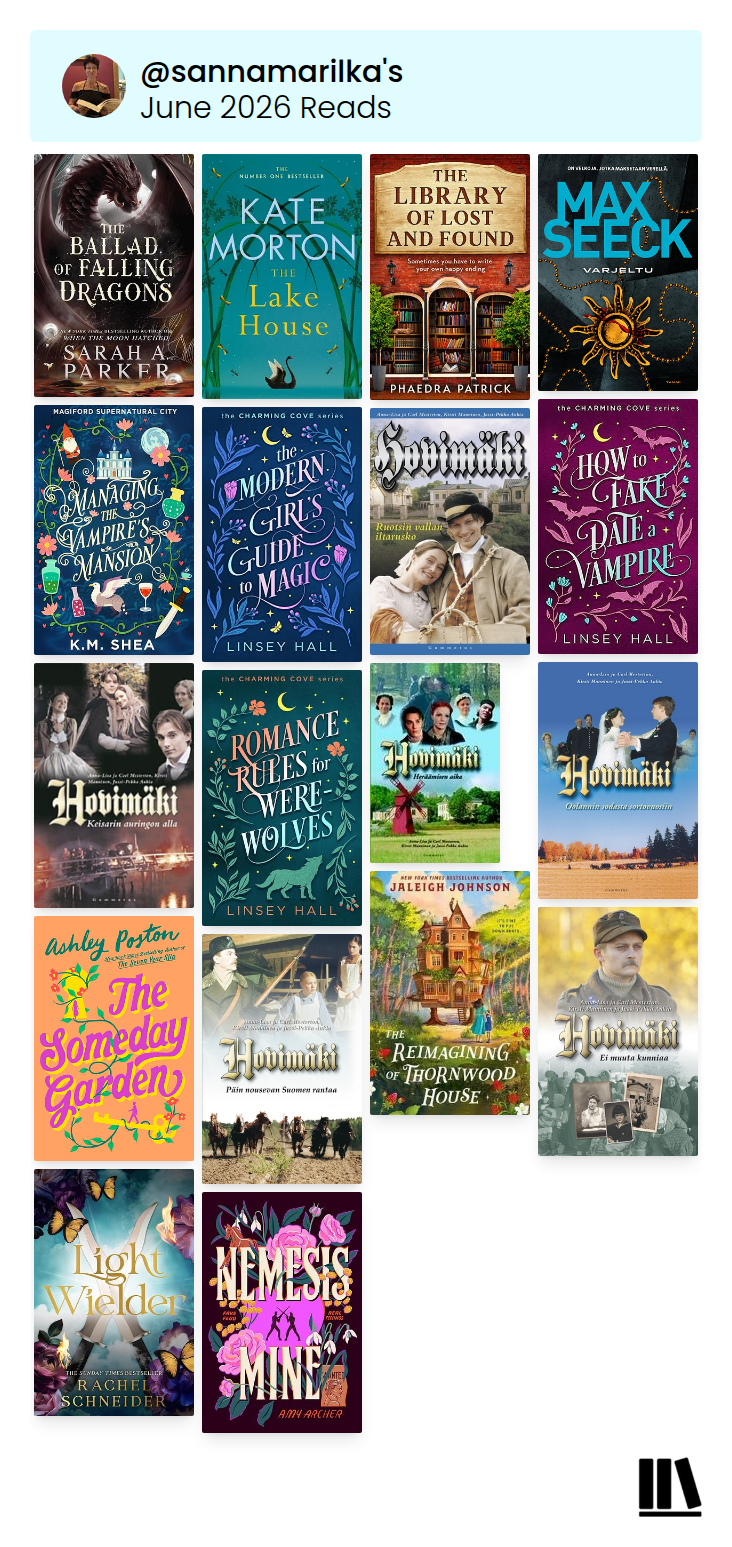
June was a month of historical fiction mixed with fantasy, and a couple mysteries (cozy & crime), and more Finnish than in a long time, what with 7/18 books were Finnish this month. I had originally planned to read the six book Hovimäki series during my summer vacation that started on Monday, but I got impatient and ended up reading the entire series during the two weeks preceding my vacation 😄 All in all, June was 18 books, 7 170 pages, apparently 50-50 Kindle-print.
The Ballad of Falling Dragons (Moonfall 2), by Sarah A. Parker – I guess this series could be called high fantasy, and while it’s intriguing, the storytelling is a bit of a drag for me. Anyway, the battle over the continent is only getting started, but I think it will go forward without me. Maybe.
The Lake House, by Kate Morton – Historical fiction, with the trademark Morton dual-timeline. A compelling story with a mystery unravelling, old wounds being opened and healed, secrets unveiled and truths found. Loved it 💜
The Library of Lost and Found, by Phaedra Patrick – Another dual timeline (cozy) mystery, though more on the contemporary side of things. Family secrets and healing, love lost and found, a story of letting people in and finding yourself in the process. A warm and sweet story.
Varjeltu (Milo 3), by Max Seeck – The final book in the Milo trilogy. Guaranteed Max Seeck quality with suspence and plot twists and seemingly unrelated threads weaving toghether into a tapestry of crime and secrets revealed.
Managing the Vampire’s Mansion, by K.M. Shea – A delightful stand-alone romantacy introducing me to K.M. Shea’s Magiford world of urban fantasy – there will be more Magiford in my reads in weeks to come! There’s all manners of supernaturals coexisting with humans, some still hiding, most not, the vampire in this book adamant about staying hidden, but the new manager of the mansion puts it all in danger, including the vampire’s heart.
The Charming Cove series 1-3, by Linsey Hall – Three stand-alone stories situated in the hidden magical community of charming Charming Cove, but still best to read them in order as the familiar characters do appear in the books in order. Romantacy stories, where each pair of protagonists has their own set of hurt and trauma to overcome before they can have their happy ending. And gotta love those quirky familiars!
The Modern Girl’s Guide to Magic – The witch with erratic power returns home to Charming Cove (not entirely by choice) and is pushed into a competition against a few other witches and the mage who broke her heart. To win is to ensure the future of her family’s livelihood, to lose is to lose everything, so no pressure there.
How to Fake-Date a Vampire – Have to say, vampires aren’t exactly very vampiry in this story, but whatever, the story is kinda cute, though a bit far fetched (in the sort of reality based lines). I enjoyed it quite well anyway. Another witch here struggling to find her true powers, and love in the process.
Romance Rules for Werewolves – A witch who ignored her power for so long that it became a knot inside needs to find a way to reconciliate with it if she’s to accomplish the feat of restoring the cranky house she inherited, in just one month. The cursed werewolf in the boathouse both think they own does not help the situation – or does he?
Hovimäki series 1-6, by Anna-Lisa Mesterton, Carl Mesterton, Kirsti Manninen, and Jussi-Pekka Aukia – Ranging from the mid-seventeen hundreds to the second World War (with an epilogue at the turn of the millenium), the series follows two families – that of the manor, and the manor’s blacksmith – through two centuries of Finnish history. The lives intertwine, the story introduces characters of every kind – kind and not so kind – beautifully depicting the ever-changing society, leading the reader through life, love and wars in a truly engaging manner.
The Someday Garden, by Ashley Poston – A story about grief and new starts, of guilt and forgiving, of finding the courage to let people in, to let go of hurt and pain. A beautiful romance set in a magical garden that is set out to heal hearts and lives of those who care for it.
The Reimagining of Thornwood House (Magic of Iskendra 1), by Jaleigh Johnson – A heartwarming tale about a mother’s love, big hearts, community and love. And a bit of deception and greed to make it a mystery. Loved the book, looking forward more Iskendra stories, whenever they might be available.
Light Wielder (Fire & Metal 2), by Rachel Schneider – After the heart stopping cliffhanger of a plot twist of the Metal Slinger, I was anticipating another thrilling read, but I was kinda quite disappointed with this book. Too much war, too much deception and too little direct communication totally exhausted me. So, blah.
Nemesis Mine, by Amy Archer – Assistant to the Villain meets TJ Klune. I totally loved this gay romantacy novel and my only regret is that I got it in Kindle instead of print 🤣 Though who knows, it might end up in my library too, next to the Klunes. Anyway, champions and wrongdoers, staged enmity between enemies who not unexpectedly turn into lovers and discover that the world is not black and white after all, and people are not either good or bad but a little bit of both, mostly. Sweet finale to my June reads 💜
Jun 7, I remember when reading Moonfall book 1 (When the Moon Hatched), I wasn’t exactly thrilled with some aspects of the story, while I did find it compelling at the same time. I then wrote about the book: ” I have high hopes that I might enjoy the next book(s) even better, since this was one of those cases where I love the book while really not liking the protagonist much; she starts to unravel a bit in the end so maybe she’s less annoying in the next book.”
Well, today I finished book 2 (The Ballad of Falling Dragons) of what isn’t just a trilogy, but planned to have 6 books altogether. The protagonist was only mildly less annoying, the storyline somehow sluggish, and the evil a bit too many steps ahead all the time. This book had an ending that satisfied me sufficiently that unless I forget that reading these books is a bit tedious to me, I think I’ll leave this series here. Sure, the evil is not beaten, but it can be beaten without me reading about it.
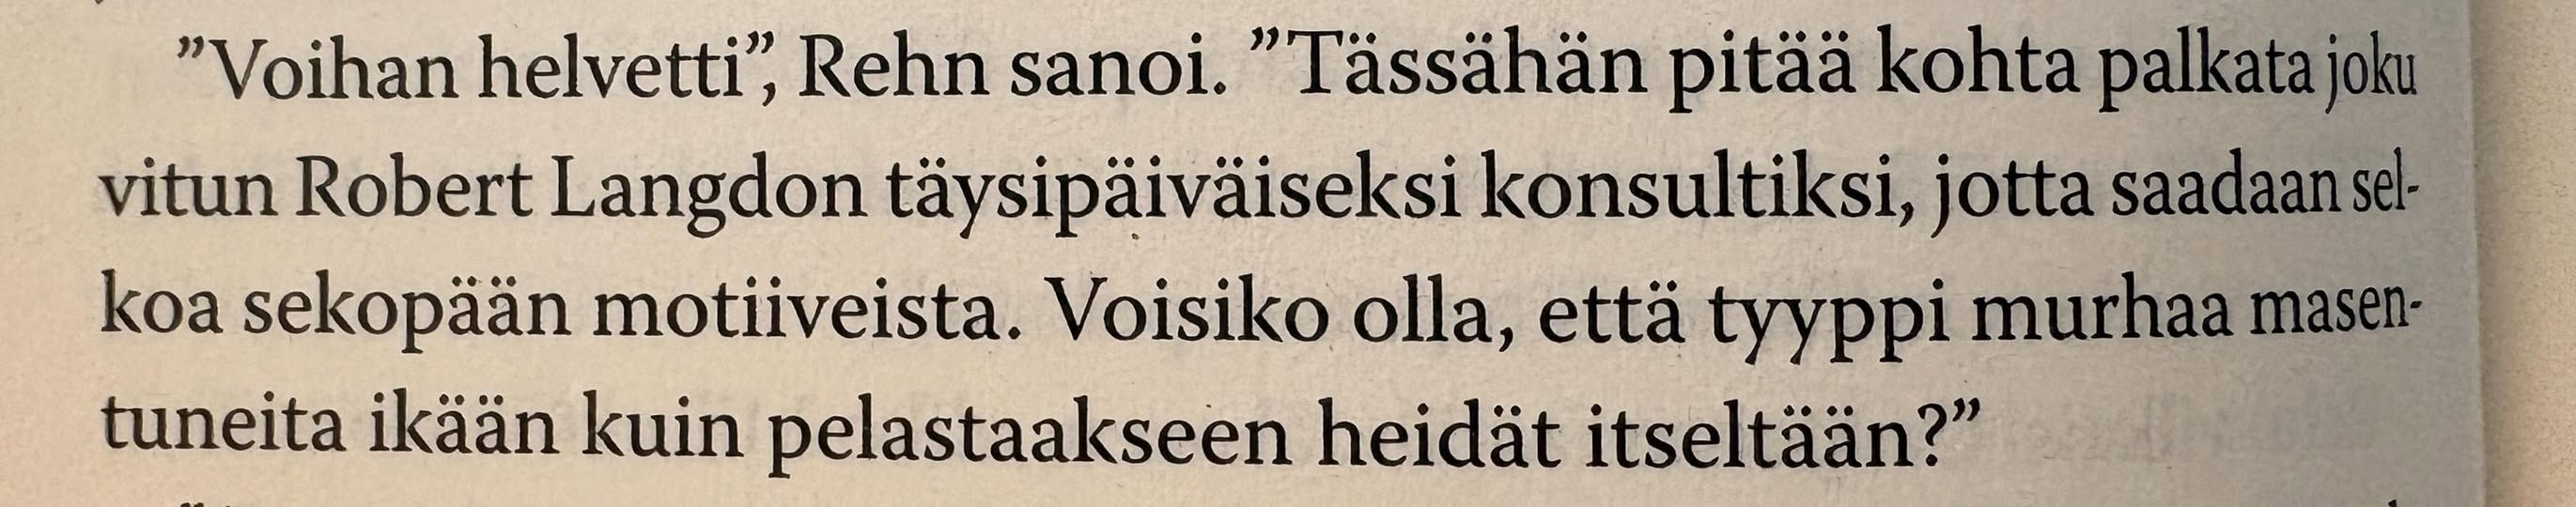
Jun 11, Max Seeck’s nod to Dan Brown, in this last Milo book Varjeltu:
Quote translated: “Fucking hell, soon we’ll need hire some fucking Robert Langdon as a fulltime consultant to figure out the motives this madman.”
Jun 28, Yesterday, I finished the Hovimäki series (by Anna-Lisa Mesterton, Carl Mesterton, Kirsti Manninen, and Jussi-Pekka Aukia) of six books covering Finnish history from the sunset of the Swedish rule in the late 1700s through the Russian rule, past our independence to the summer of 1940 after the Winter War, with an epilogue set in 1999 and ending at the turn of the millenium.
I really enjoyed the series, the stories wound around the two main families of the Hovimäki manor and their blacksmith. The last two books covered much of the same as Under the Northern Star, except mostly from the white side of things. I would’ve sort of hoped the series had ended before Winter War, but at least it didn’t go all the way through WWII – I try to avoid those Great Wars anymore, because they’re kind of exhausted already.
Also, I was brought up with the stories, and the bitterness of my evacuee grandma who lost her home in Viipuri as a teen, in WWII, and I recognize the burden of planted feelings every time I read about the time and events. It’s all extra weight I don’t need to carry, so I try to avoid it, since I’m not exactly able to completely rid myself of them. I mean, it doesn’t help anything, dwelling on the wrongs of the past beyond understanding them.
Unfortunately the expectance of war in the last book also strikes true for this time and age – another thing I try my best not to focus on and worry about since there’s really nothing I can do about it and I don’t want to ruin my days being scared. Still, as Väinö Seppä responded to his wife’s queries about war: “it’s no more a matter of if, it’s a matter of when”, I let out a little sigh. We haven’t had even a hundred years of peace here.
More than that, though, this series, or rather that last part of it when families got scattered all over and the modern world started taking its somewhat chaotic shape (compared to the set ways of the feudalistic countryside), had me wondering again whether people were actually happier before or not. In the end, life is still an endless pit of struggle and worry and wars, and now we don’t even have the village around us.
Maybe it’s best I just trod on to the magical wolrd of the Life Wielder (Rachel Schneider) and leave the real world behind again. I admit reading to me is escapism in it’s purest form, even though I occasionally delve into stuff that forces me to ponder real life for a while. As it is, I prefer to deal with it as little as possible in general, spending my time in magical (or at least fully fictional) realms instead 🤣
Jun 30, I think I’m too autistic for Light Wielder (by Rachel Schneider). I have a hard time with all the conniving and plotting and deception and betrayal and no one meaning what they say, the secrets and twists and dishonesty and distrust. I so want to love the book, but it exasparates me. I can’t just go expecting everything is a lie, not understanding what is real and true in the story, what is not. These layers of manipulation and politics (and war, I get so tired of war) make me want to toss the book aside, but I’m too stubborn to do that.
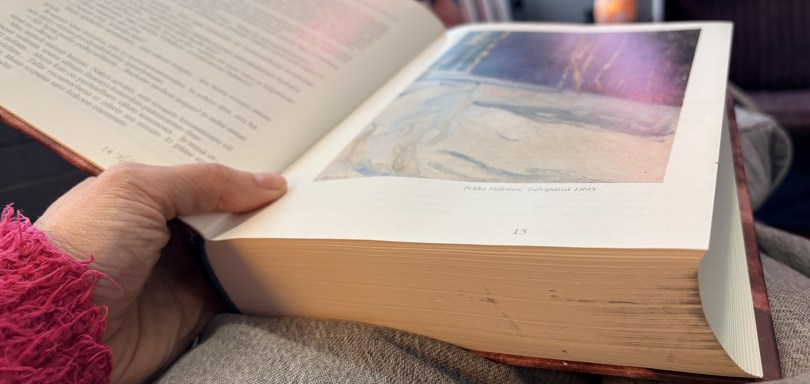
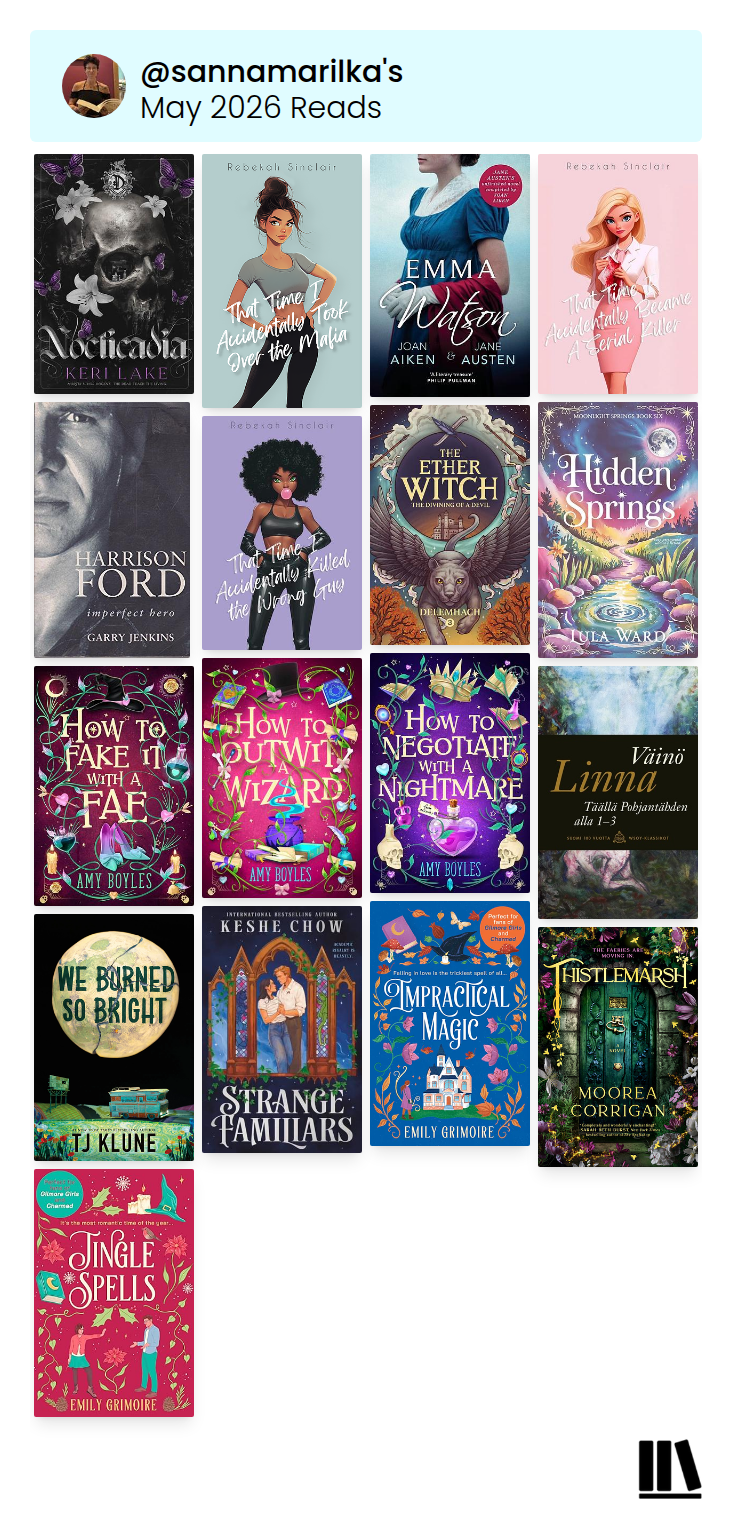
So, May. Still only once or twice was the weather supportive of reading outside, but that’s just circumstances. While I made several book orders from Adlibris at the end of April and beginning of May, there was a week or two where I was waiting for new books to arrive, giving me the incentive to read something that’s been patiently waiting in my shelves instead (oh, I have a LOT of those, waiting for the mood to hit!). I ended up finally reading one of the great Finnish classics, Täällä Pohjantähden alla (Under the Northern Star), a trilogy that I happen to have as one slighlty intimidating brick tome volume (beautiful edition with prints of classic paintings for illustrations, and a fake leather binding 😄), and I really enjoyed it!
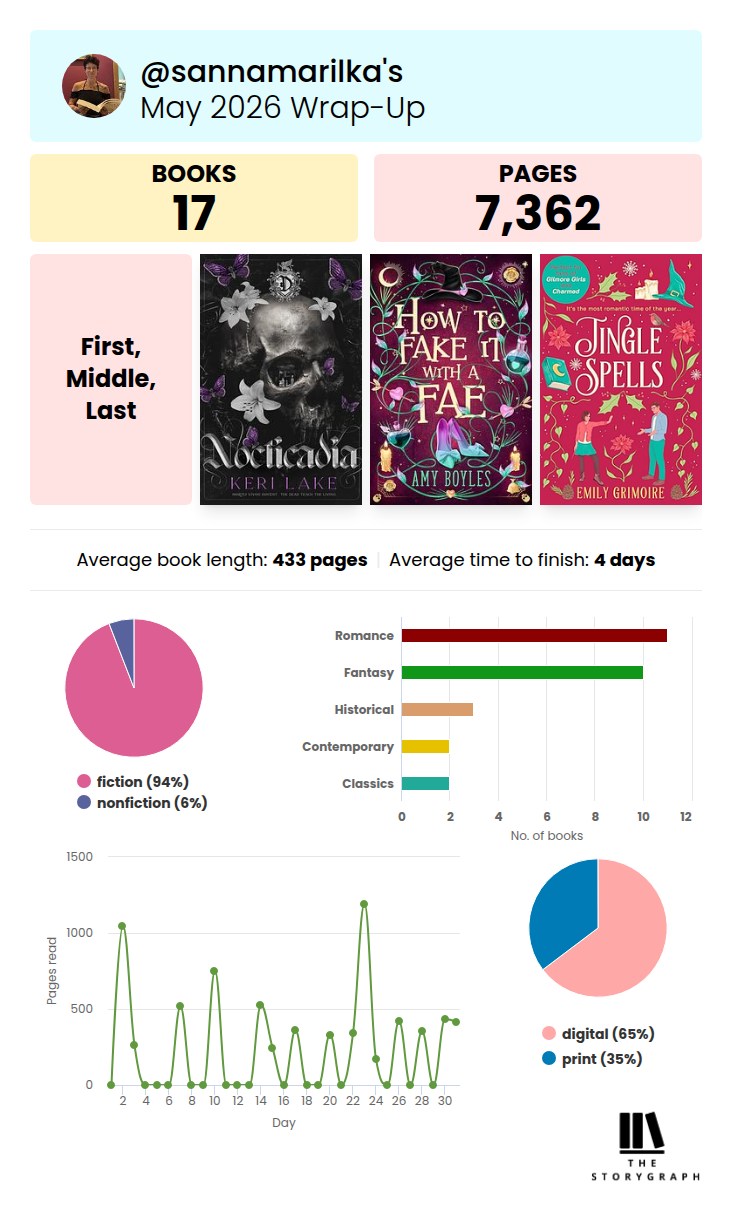
All in all I read 17 books, a total of 7362 pages. There were some real long books (like the aforementioned tome), but a few shorties in the mix too – I was kinda disappointed that the long-awaited new TJ Klune book “We Burned So Bright” was actually only 160 pages or so, making it a snack book rather than a full meal. Loved it though.
That Time I Accidentally Took Over the Mafia, by Rebekah Sinclair – So funny, a total wild ride from start to end! Action, speed, wild chased, a surprise (or not) in the end, and of course the hot sex. Polyamourous relationship plot, with multipartner sex too – granting that there were some a bit hmm, surreal moments that kinda bypassed biology and physiology 😄
Nocticadia, by Keri Lake – This was a bit of a slow start for me and for a while I thought it’d be a drag, but then it pulled me straight into its web and I couldn’t put it down! The entire book has a sinister and charged atmosphere, charged with secrets and evil, heightened by the romance. And an ending that leaves room for a book 2, while not exactly suggesting there will be one. So leaving one in some more suspence, sort of 😂
Emma Watson, by Joan Aiken – A shortish novel based on the unfinished beginnings of Jane Austen’s “The Watsons”. I was a bit disappointed to be honest. I expected the book to take the original and continue from there; instead the book was built on top of it, yes, but somehow missed the Austen style and ambiance by a mile.
That Time I Accidentally Became a Serial Killer, by Rebekah Sinclair – My least favorite of this series (three books, at least so far), mainly because I couldn’t handle the total breach of privacy (and consensuality) by the stalker, good intended as it may have been, nor the protagonist just somehow being ok by it all (with minor struggle) because the stalker was sexy – her background making it all the more unrealistic.
That Time I Accidentally Killed the Wrong Guy, by Rebekah Sinclair – Back to a wild ride full of (a bit gortesque) humor in this book, which I again loved. An unlikely partnership, betrayal (or was it?), and plot twists that you kinda could see coming from afar, but then they hit you in the face anyway.
Harrison Ford: Imperfect Hero, by Garry Jenkins – A bit of an old bio, but a good one, in general. Just kinda funny moments reading some opinions and conclusions of a life that has been moving on for more than two decades since the book was written. Biographers of people who’re not dead yet, should really remember not to write conclusive statements about anything; it just makes the book age bad.
The Ether Witch: The Divining of a Devil (The Ether Witch 3), by Delemhach – I had so been waiting for this! I preordered the Kindle version as soon as it was available for preorder – and was puzzled but happy when I downloaded to my Kindle immediately and not in late June. Apparently a glitch in the process, making it available immediately, but I was not sorry. Great read, great ending for Tam and Eli’s story, though a bit sad to bid goodbye to the House Witch world and characters for good (I think).
Hidden Springs (Moonlight Springs 6), by Lula Ward – The finale for the Moonlight Springs saga, bringing toghther all the stones and resolving the threat of unraveling for good. These books seem to me like written by (or at least heavily assisted by) AI, but be that true or not, the writing is a bit clumsy and redundand, especially in the first books – it got a bit better towards the end – which bothered me to an end, but I still liked them enough to read them all.
Books 1-3 of the Seven Suitors for Seven Witches, by Amy Boyles – Funny, witty romantacies with a bit of a mystery in each. Seven sisters who each need to marry in order to restore/save the family magic. As it happens, they all seem to (accidentally) stumble into deals with someone they deem enemy but find “true love” with in the end. Yes, enemies to lovers, kinda, but then a bit more nuanced than that. And spiced up just so, the way I like best. Currently we have three books, but I would assume there’s four more to come 😏
How to Fake It with a Fae – The eldest witch who believes that she’s really not a witch at all since she appears to have no magic, gets accidentally bound into a magical engagement with the fae king living in the spooky castle at the edges of the village. One who’s out to get the Thornrose family for reasons of his own.
How to Outwit a Wizard – He cheated on her in high school, breaking her heart. Or did he? He became a playboy, or so it would seem, but it’s more complicated than that. Good intentions and roads to hell and all that unravel in this one where the second daughter is reunited with her high school boyfriend as a means to an end. Just that the end may be different than planned.
How to Negotiate With a Nightmare – The third sister is hellbent on getting out of any marriages, yet finds herself married to the Nightmare King in a snap of fingers, finding her own happy ever after in an unlikely place, with an unlikely husband. Is it a nightmare or a dream come true?
Täällä Pohjantähden alla (Under the Northern Star, full trilogy), by Väinö Linna – A epos of love and war and social and political struggles of a country being born. The story follows the family of Jussi, the servant who becomes a crofter, dreaming of owning the land some day, and the village he lives in. It spans over several decades, staring in the late 1800’s where Finland is an (autonomous) part of Russia, flowing through the declaration of independence, the civil war that followed, and the first decades of a country trying to resolve the political division of people to reds and whites, all the way to the end of the WWII. The story colors the outlines of history, approaching it all from the very heart of issues: the class divide, the wish to have a better life, the oppression inside the country, explaining why we are now who we are and why certain attitudes and structures exist. Excellent read. Hands down. Something for every Finn to read.
We Burned So Bright, by TJ Klune – A short novel, or a long novella. A beautiful story about life with all its colors. Sorrow, regret, pain, unspoken and carried alone while together. Joy, love, happiness, a past and a future that won’t be. Absolution at the end of the world.
Strange Familiars (The Seamere College 1), by Keshe Chow – It’s a world where magic powers everything, but no one can use it for free, as it’s harvested, controlled, and distributed by corporations, and corporations mean greed, even at the expense of human lives. Gwendolynne and Harrisford come from the very opposite ends of society, are sworn enemies fighting for the first place in a graduating class, but that naturally is a fertile breeding ground for romance, and when they are sort of accidentally thrown together to investigate the magical anomalies, they find a magic of their own. And then things go kinda haywire and there’s not even a peep about the second book anywhere yet 😭
Impractical Magic (Oak Haven Witches 1), by Emily Grimoire – Cozy mystery where the home and an entire existance of the witches of Oak Haven is under threat. Three sisters who lost their Papa in the previous attack a good ten years before, leaving the family broken, the middle child having left and sworn off magic altogether, with a guilt that is or isn’t entirely warranted. She returns, there’s the old “will they or will they not” best friend, and there’s the “oh for fuck’s sake, pull your head out of your ass already” frustration for the reader. All in all, lovely sweet read.
Thistlemarsh, by Moorea Corrigan – One of the best reads of this year, this is a fairy tale much the likes of Emily Wilde’s adventures. Mouse finds herself in an impossible situation, the inadvertedly freed fae sees an opportunity, it is supposed to be a win-win, and in the end it is, but first it’s all turned upside down because the unsuspected Fae King is full of surprises. Simply superb!
Jingle Spells (Oak Haven Witches 2), by Emily Grimoire – Christmas time in Oak Haven, old rituals leave the witches vulnerable and old enemies take advantage. Delilah, the oldest of the sisters, is the protagonist of this book, returing from her globe trotting of the past year to help save her home and perhaps find love, while at it.
May 3, I was so excited to read Emma Watson (by Joan Aiken), the finished story of Jane Austen’s The Watsons, but I have to say I was somewhat disappointed. The book started where The Watsons left off, which in itself is sort of ok, but seeing as the original is just some 50 pages of a rather unknown beginnngs of a story, I would’ve expected it to be included in this book. Aiken did do a relatively good job of recounting the events of the original, but I can’t help but feel the original set of characters fell short and lacking of their depth in this book.
The narrative of Emma Watson was not exactly what I’d call Austen-y, especially not the latter half. It was a bit all over the place, characters were too many and flitting through, events that Austen would have made the center of the story, were delivered with a sentence or two, after the fact. This book was a hoolabaloo of events and everything rolled too fast for anything to have real weight. It wasn’t a bad book, it just wasn’t what I expected and not really faithful to Austen at all. Pity.
May 9, So, this Accidentally series by Rebekah Sinclair. I loved the first one (That Time I Accidentally Took Over the Mafia), well for the most part anyway. It was a wild ride! As is the third book, That Time I Accidentally Killed the Wrong Guy). Both have longer sex scenes than I generally have patience for, but still, fun and quirky in a delightful way, and the polyamory of the first book totally was the cherry on top of the cake (disregarding the last bit where science and biology were totally ignored).
The middle book, though. The “legally blonde” that everyone gushes about. That Time I Accidentally Became a Serial Killer. I loved to hate it and hated to love it, and was not able to rate it, because while kinda sorta awesome, the invasion of privacy and integrity and the Stockholm Syndrome of sorts totally icked me out. Creeped me and disgusted me. Everyone for their own, I figure, but still, the non-consent from the start was too much. Other than that, I enjoyed it.
May 20, I used to read a lot of historical fiction when I was young. Then I kinda burned out on it. It’s still not a favorite (and political history even less so), but I have a generally relatively well-hidden socio-political bone, that finds certain works of historical fiction extremely nourishing.
Like Täällä Pohjantähden alla (Under the Northern Star) by Väinö Linna. A Finnish classic for sure, but simply an epic saga of how Finland as it is today, was born. The story brings reasons, causations, and people to life and to light in an excellent manner, in a way no school history book or class ever could. It’s not just a story, it holds the seeds of our current society and how and why it all unfolded as it did, in its pages.
I loved Linna’s classic Tuntematon sotilas (Unknown Soldiers) as a teen, but apparently had to live to be 50 before having the courage to tackle this opus of 1200 pages (it’s a trilogy, but I just so happen to have it in a single bind, making it an intimidating tome 😄), and now this experience is prompting me to start reading the Hovimäki series, which I kinda inherited from my grandma (minus book 5 – for some reason that is missing 🤨 need to hunt it down). It takes the reader even further down in Finnish history.
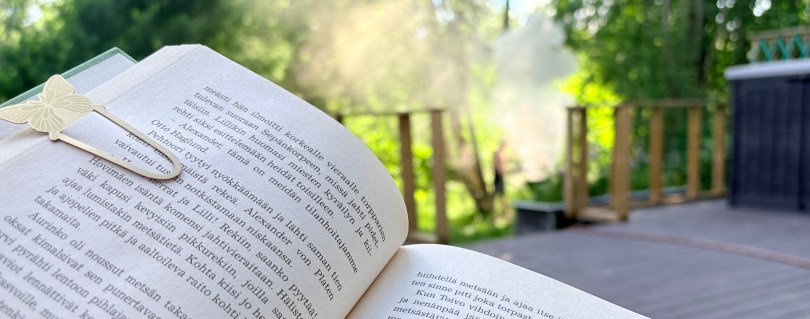
Spring started properly early here, but then it slowed down into a stall. What’s that got to do with reading, you ask? Well, only that while we did go on a couple longer strolls with the dogs on some particularly nice days, the outdoors didn’t entice us out and about too much, thus keeping me indoors, reading. I did spend an hour or so maybe twice on our deck, reading in the sun, where my hanging egg-chair is sheltered from the wind.
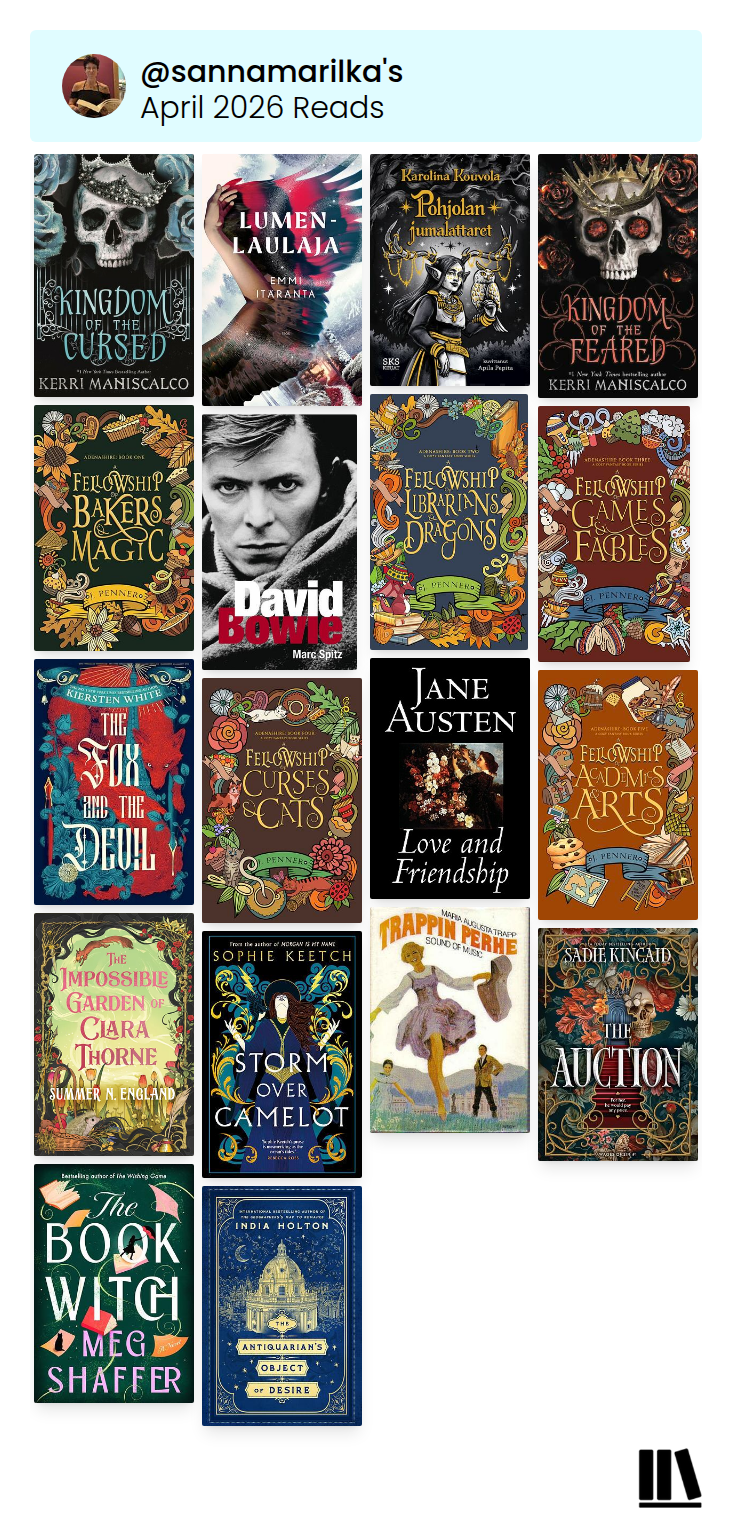
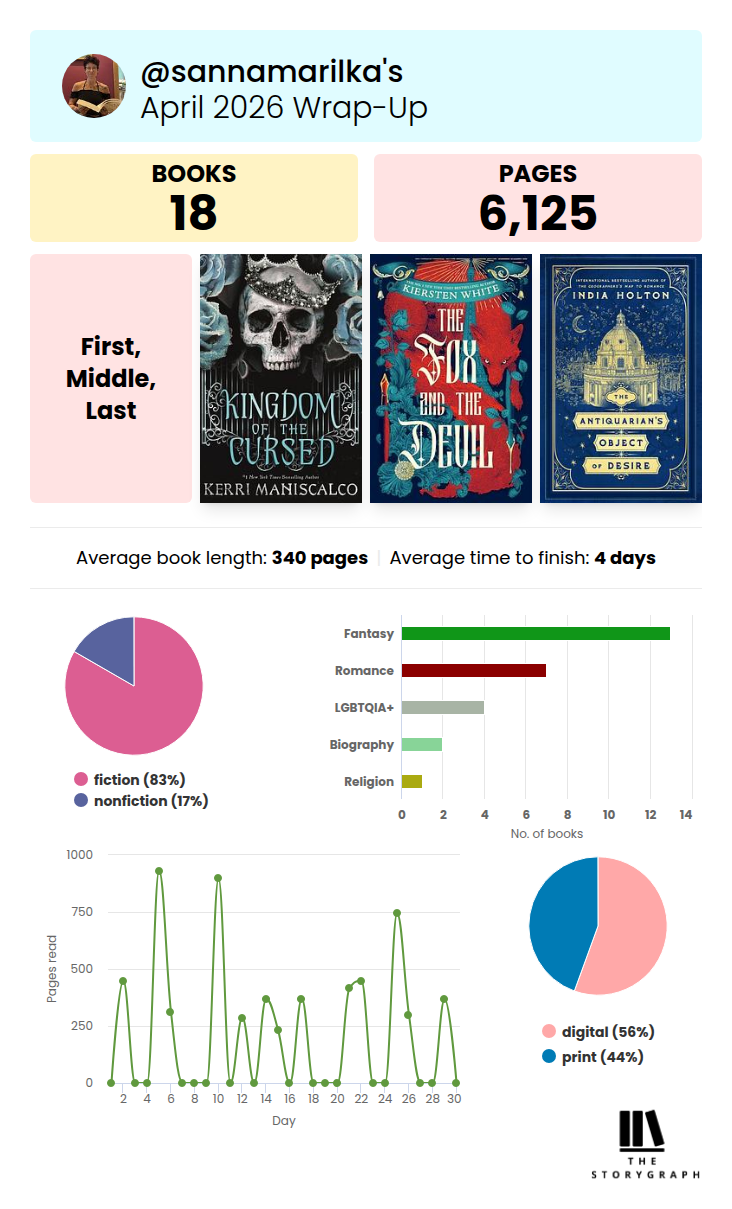
So anyhow, 18 books, 6125 pages, average book length 340 pages – a mix of quite long ones, a couple of 120-150 page snack books, and everything in between.
Kingdom of the Cursed and Kingdom of the Feared (Kingdom of the Wicked 2 and 3), by Kerri Maniscalco – Love, family, demons, witches, and goddesses, a plot twist or two, and every story has two sides, as usual. Delicious, dark, and spicy, but love wins in the battle of power over the circles of Hell. Satisfying reading, great trilogy!
Lumenlaulaja, by Emmi Itäranta – A bit of Finnish mythology, the story of the great witch Louhi from Kalevala, told from her point of view, sort of capsizing the entire male-centric pov of Kalevala. Here the female witch is not an evil to be controlled and slain (well, she IS), but rather a strong woman trying to protect her own. And what could be more threatening to men than a woman not in need of one? Fascinating book.
Pohjolan jumalattaret, by Karolina Kouvola – Bit of a snack book after Lumenlaulaja, with a short article about the old deities of Finnish mythology. They are legion, many of them overlapping each other, variations of the same in different areas.
Adenashire books 1-5, by J. Penner – Five cozy feel-good fantasy romance books, a sixth one will be out in March next year. The books:
A Fellowship of Bakers & Magic – Where it all begins, with Arleta and the baking contest that leads her to Theo (or rather, Theo leads her to the contest, but you know), and new friends who all follow her back to Adenashire, each for their own reasons.
A Fellowship of Librarians & Dragons – Doli, the Dwarf with a huge heart, the one who originally pulled both Arleta and the reluctant Fennex Jez into their fellowship of hearts, finds her own happy romance in Adenashire.
A Fellowship of Games & Fables – When Jez inadvertedly throws herself and the High Elf baker-and-fellow Taenya into a whirlwind of winter games and fake-dating, the world may be frozen by mid-winter, but that doesn’t keep hearts from melting.
A Fellowship of Curses & Cats – Theo gets his own book. He has some issues and fears that surface when he’s about to become a father, and then his mother shows up, not helping anything at all. Or… is it, actually? At least Theo has Arleta and the rest of the fellowship for comfort, and don’t forget all them cats!
A Fellowship of Academics & Arts – It’s a tense night at the bakery, where the fellowship is waiting for word while Arleta is at the midwife’s, giving birth to her and Theo’s baby. What better way to while away the time than with a story? So, Verdreth is coaxed into recounting the story of how he and Ervash found their love and ended up in Adenashire with Arleta’s family.
David Bowie, by Marc Spitz – The life and music of David Bowie, extremely detailed but not. Seemingly crammed with everything the author managed to dig up, but only as far as they interested him, I think, what with skimming through some events and collaborations with barely a mention. Not that good of a bio, imo.
The Fox and the Devil, by Kiersten White – The daughter of Van Helsing chasing the woman she believes killed her dad, only to get obsessed and entangled with her and find out the world is full of monsters – but what makes a monster, after all?
Love and Friendship, by Jane Austen – A shortie with short stories from Austen’s youth, most of the stories incomplete. Satire and downright farce, I tell you! She was sharp and observant of the society, pouring it into these outlandish stories at first, it seems, then honing her storytelling into what we then have come to know as the style of Jane Austen. Fun snack book!
The Impossible Garden of Clara Thorne, by Summer N. England – What happens when a kid is unloved and abused, and what happens when they finally let themself to love and be loved. A story of magic and evil and love being the strongest power of them all. Queer romantacy, loved it!
Storm Over Camelot (Morgan le Fay 3), by Sophie Keetch – The conclusion of the saga of Morgan and Arthur, and all those close to them. The entire trilogy is an intense, excellent retelling, from the pov of a(nother) woman deemed an evil witch simply because she would not succumb to the control of men. Long live the once and future king!
Trappin perhe (orig. The Story of the Trapp Family Singers), by Maria Augusta von Trapp – The real story of the family von Trapp, written in 1949 by Maria von Trapp herself. Amazing resilience, amazing resourcefulness, just a rather amazing family all in all!
The Auction, by Sadie Kincaid – Dark mafia romance that left me with conflicted feelings. I liked (maybe even loved?) it per se, but got annoyed by the amount and extent of sex – felt like the middle third of the book was nothing but. Don’t get me wrong, the smut doesn’t bother me, it just kinda bores me… I want action that takes the stroy forward, not only into the bedroom (or whatever room or not-room, but you get the drift). Still, preordered book 2, for I do need to see the story to its end.
The Book Witch, by Meg Shaffer – Sweet and wonderful twisty kind of tale where we get to zip in and out of books with Rainy March and the Duke, where fiction and the real world mix in unexptected ways. I don’t cry with books too easily, but this one had me in tears with this beautiful scene in a library (no, won’t tell you more, read and figure it out for yourself!).
The Antiquarian’s Object of Desire (Love’s Academic 3), by India Holton – Ah, Amelia and Caleb and the fake-hating scheme of life-long best friends in this friends to lovers (or is it fake-enemies to lovers?) romance where things literally explode around when emotions run amock. Quirky, witty, funny, trademark Holton. Superb!
April 10, Finished (speed-)reading the bio of David Bowie (by Marc Spitz) today. It’s a highly detailed bio, at least about the parts that interested the author, while skating past many other events with barely a mention. Too much detail about a lot, detours and side-quests to the lives of some related people, barely a mention of others.
The whole book felt like it was as much about the author and their obsession as it was about Bowie himself. Like the author focused all interviews and research on what was meaningful and interesting to them, but didn’t bother with whatever wasn’t. So no, not one of the best bios I’ve ever read, not by far.
April 19, Snack book: Jane Austen’s Love and Friendship, ie. a collection of her unfinished writings from early years (teens, I think). In a very familiar kind of teeny way, she tried her hand at full-blown farce writing before settling on the style that later got her published. Outlandish stuff, quite fun reading 😄
April 25, I have loved The Sound of Music ever since I first saw it as a kid, though back then I always could’ve stopped watching at the point of the wedding – the romantic in me felt like that was the high point, the climax of the story so why bother with the disruptive war stuff, you know, just let them live happily ever after.
Of course I knew even then the story was based on a true one. I’ve had the book The Story of the Trapp Family Singers (in Finnish, “Trapping perhe”) by the mom, Maria Augusta von Trapp, in my library for years (and have no idea where it came from, maybe my grandparents’ library?) but never have I gotten around to reading it, until now.
How much more there is to the von Trapps! I really enjoyed getting to know the real von Trapp family and what their storied life actually was like, especially their time after they left Austria, ie. where the movie left off. I mean, just those ten years or so that the book covers, are full of adventures and escapades and humorous moments, paired with resilient labor to make a life, a good life at that, and not just their own life, but others too, by ways of music and post-war charity and whatnot. What a family!
April 25, The beautiful cover (of the special edition I saw) and intriguing RuNyx-y kind of plot description lead me a bit astray with The Auction (by Sadie Kincaid). It even started promisingly, and held it for almost half the book, but then the plot just kinda became secondary in the storytelling, fading into the background of sex and obsession and violence, but mostly descriptive sex. I mean, I’m not disturbed by descriptive sex and/or violence per se, but when one or the other or both become the main event, eclipsing the plot, I get bored. Obsession isn’t my favorite trope either, really.
So I got a bit annoyed and disappointed. And then everything just had to turn upside down in the last 50 pages or so and end with a crash bang cliffhanger. I had already decided not to continue the series (or rather, duology, as it is), but, hunh. I’m undecided now.
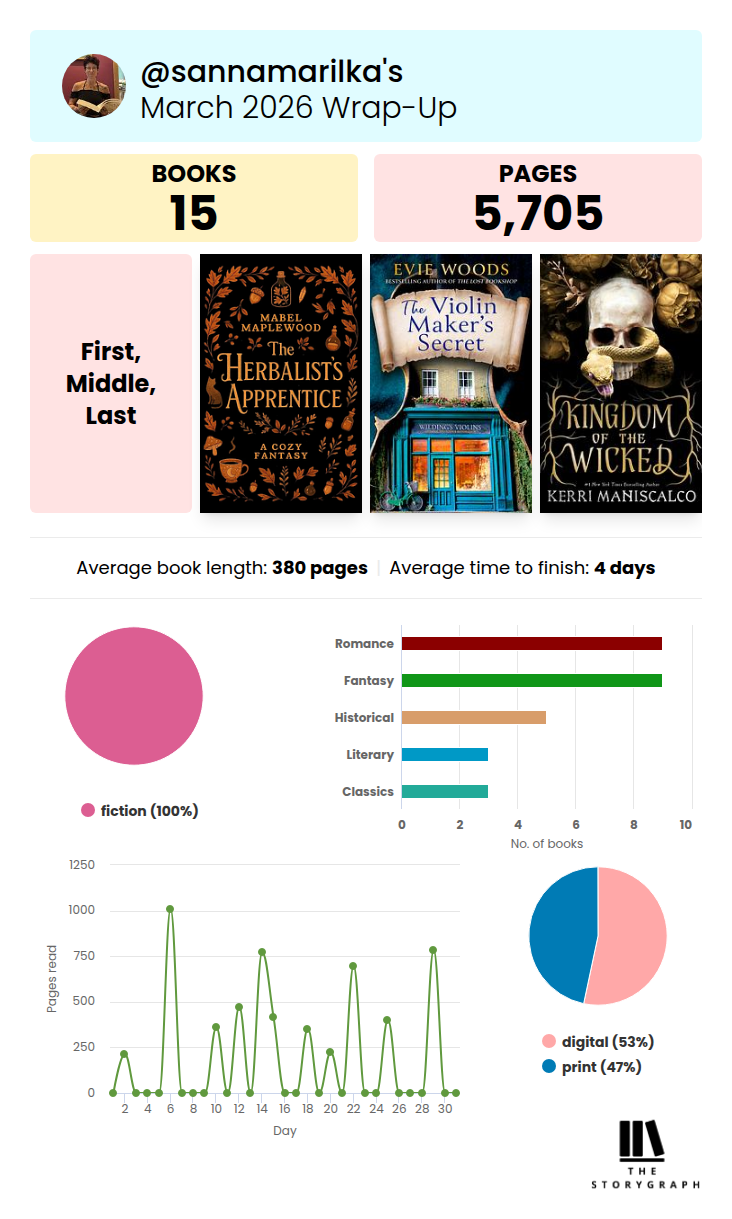
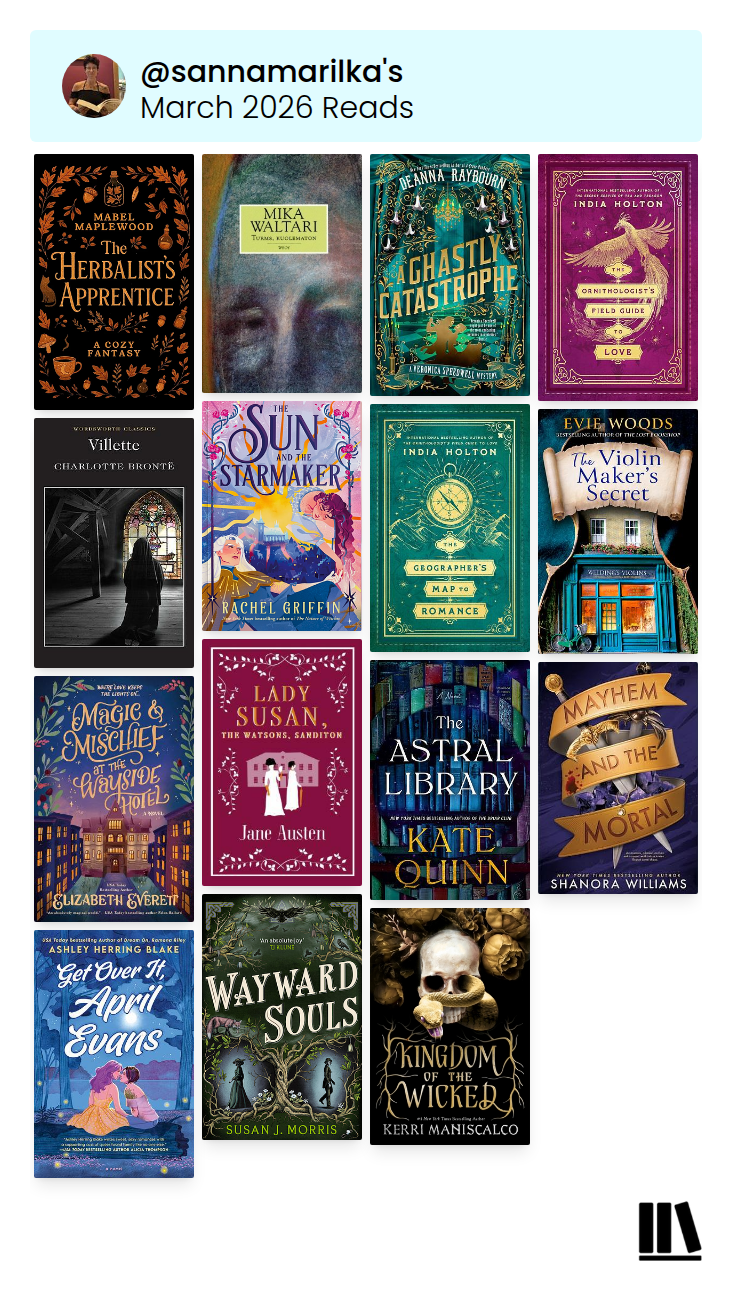
March was a mix of classics and fantasy, mostly. 15 books, 5705 pages of happy reading. Somehow I felt like it was a month of long books, books > 400 pages, but while there were many of those too, apparently there were quite a few rather short ones as well. Funny how these biases go 😄
The Herbalist’s Apprentice, by Mabel Maplewood – A sweet cozy mystery in the lines of forgiving yourself and getting past mistakes.
A Ghastly Catasrophe (Veronica Speedwell 10), by Deanna Raybourn – Ah, Veronica and Stoker! Danger and drama and danger of drama, and the treat of the guest-starring Lady Julia and Nick Brisbane!
Turms kuolematon (Eng. The Etruscan), by Mika Waltari – One of the historical tomes of Waltari, very much classics of Finnish literature. Intriguing read, though a bit long-winded.
The Ornithologists Field Guide to Love (Love’s Academic 1), by India Holton – Whimsical and magical as Holton’s books are ever. Full of magical birds and somehow villainy and heroism aren’t exactly clear 😄
Villette, by Charlotte Brontë – I guess there’s something akin to Jane Eyre in this story about the teacher and a curmudgeon, and still I liked this one better.
The Sun and the Starmaker, by Rachel Griffin – Starcrossed lovers, a fate to be challenged. Romantacy like a Chinese myth.
The Geographer’s Map to Romance (Love’s Academic 2), by India Holton – No more birds, now it’s earth rumbling with magic as fey lines fail. And the walls built by our married(!) protagonist couple crumble down too. What a fate – to fall in love with your spouse! Though more like allow them to find out you fell in love long ago.
The Violin Maker’s Secret, by Evie Woods – Magical realism. A violin born from love and tragedy, singing the sorrow of the soul bound to it. Coveted by many. Too many.
Magic and Mischief at the Wayside Hotel, by Elizabeth Everett – Romantacy in a sentient “hotel” that’s stuck on earth with a guest list including a vampire, the Fate sisters, fairies, a bloodthirsty gnome and whatnot, even a god or two in the mix. And there’s more to come \o/
Lady Susan / The Watsons / Sanditon, by Jane Austen – Some less known novellas/short stories by Austen. Lady Susan was a bit meh but obviously completed, whereas The Watsons really should have become a novel, same as Sanditon (which has been completed into one or maybe few versions, one of which I’ve read; probably there’s completed Watsons around too, hmm).
Mayhem and the Mortal, by Shanora Williams – D&D meets Wizard of Oz, enemies to lovers romantacy adventure, a wild goose chase with an unexpected ending (and honestly, there NEEDS to be a sequel for this!)
The Astral Library, by Kate Quinn – Who wouldn’t want to roam through their favorite (public domain) books? Or live in one for good? As long as the ignorant forces stay away.
Get Over It, April Evans (Clover Lake 2), by Ashley Herring Blake – LGBTQ romance, enjoyable read .💜
Wayward Souls (Harker & Moriarty 2), by Susan J. Morris – So, Ireland, and Samhain is nigh. Sam and Hel save the day, but Professor Moriarty is still on the loose, so expecting a book 3.
Kingdom of the Wicked (Kingdom of the Wicked 1), by Kerri Maniscalco – First in a wicked enemies to lovers trilogy. Someone is murdering youn witches, but is it the demons, or is it your neighbor?
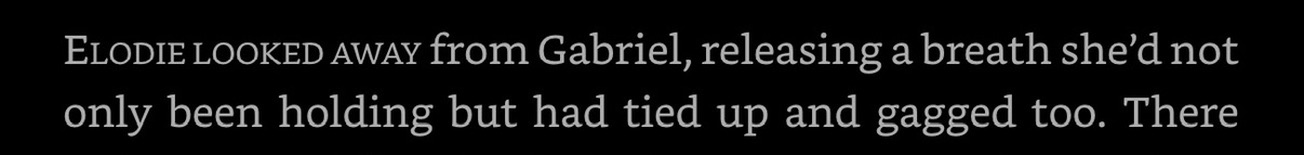
Mar 11, Reading India Holton’s next series (Love’s Academic) now, and I mean, her satire of every (romance) trope! Now inns don’t necessarily have even just one room left (unless such is specifically orchestrated, in which case it is the honeymoon suite), and never mind the matter of a bed. There may be a storage room with seven beds – but they’re all stacked on top of each other. Then again, the innkeeper just might surrender his kids’ rooms with sufficient bribary. And, well, you can’t have sex in a kid’s bed, now can you?
And lo and behold, the issue of holding (or inhaling) your breath! “…releasing a breath she’d not only been holding but had tied up and gagged too.” Take that unconscious breath-holders!
Mar 12, Finished Villette (by Charlotte Brontë) today and I don’t know if I really liked it better than Jane Eyre, or if the latter simply was colored in my eyes by hype (which makes me shy away from even things I might like), but I do claim to have enjoyed it (more? unlike?). I mean it is overly long, and at times boring and boorish, and it reads like a spoken narrative, with narrational styles flipping back and forth sometimes rather annoyingly, and it happily mixes in untranslated French in dialogues (though I do read that to an extent so not entirely lost on me), but the story is quite an agreeable one.